


Statistics for Enrolled Class of 2027
(as of Aug. 21, 2023)
Class Overview
(first-time, first-year)
- Total enrolled: 1,366
- 51% of students in the class are female and 49% are male.
- 17% of students in the class are the first in their families to go to college.
- 66% of students in the class qualify for financial aid.
- 22% of students in the class are eligible for need-based Federal Pell Grants.
Middle 50% SAT Scores
- Math 780-800
- Evidenced-based Reading and Writing: 760-780
Middle 50% ACT Scores
- Composite score: 34-35
Secondary School Type
| Type | Percent of Class |
|---|---|
| Public | 60 |
| Independent Day | 19 |
| Religiously Affiliated | 12 |
| Non-U.S. Schools | 13 |
| Independent Boarding | 8 |
| Home-schooled | < 1 |
| Military | < 1 |
Diversity
| Group | Percent of Class |
|---|---|
| Asian American | 26 |
| International Citizens | 14 |
| Hispanic or Latino/a/x | 10 |
| Black or African American | 9 |
| Multiracial | 7 |
| American Indian or Alaska Native | < 1 |
| Native Hawaiian American or Other Pacific Islander | < 1 |
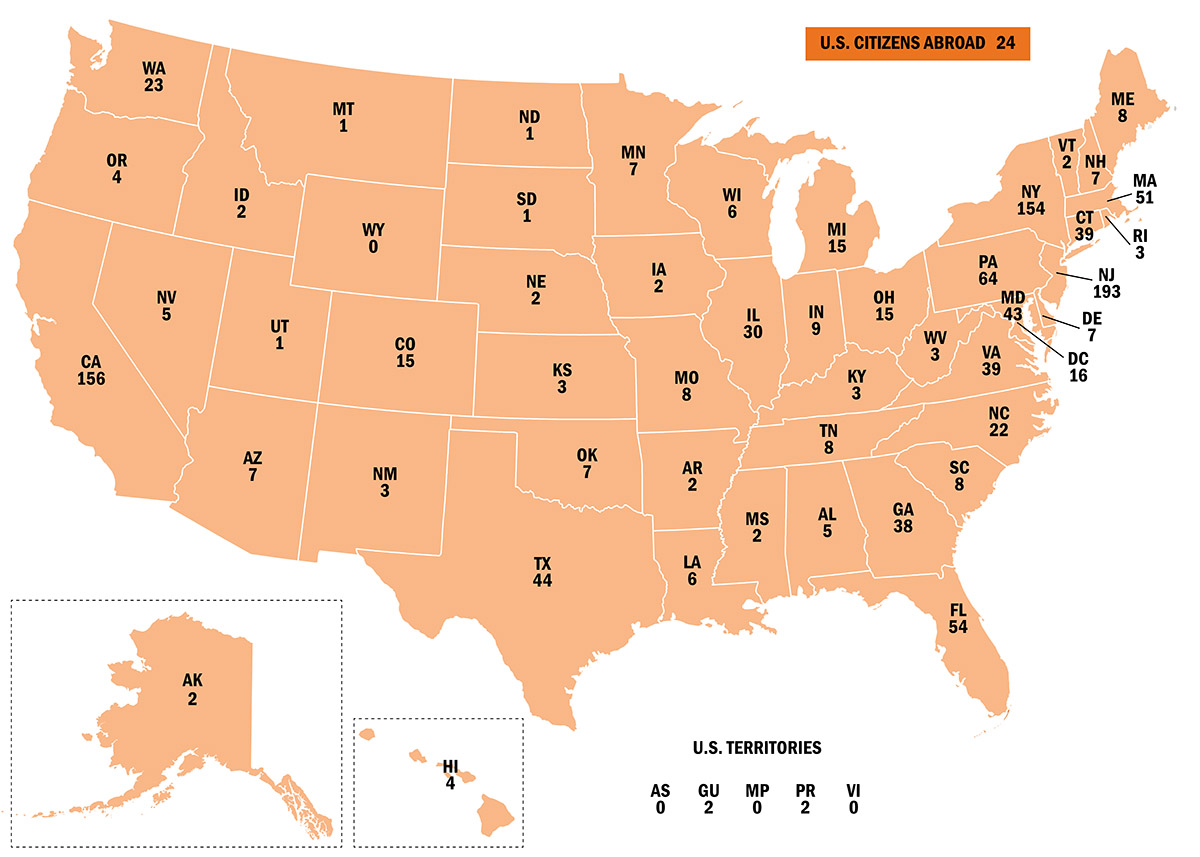
Enrollment by U.S. States & Territories
Citizenship
The Princeton Class of 2027 includes international students who are citizens of the following 64 countries:
| Country | |||
|---|---|---|---|
| Afghanistan | El Salvador | Kyrgyzstan | South Africa |
| Albania | Ethiopia | Mexico | South Korea |
| Argentina | France | Mongolia | South Sudan |
| Australia | Germany | Nepal | Spain |
| Bosnia and Herzegovina | Ghana | Netherlands | Sri Lanka |
| Brazil | Greece | New Zealand | Syria |
| Cambodia | Guatemala | Nigeria | Tanzania |
| Cameroon | Hong Kong S.A.R. | North Macedonia | Thailand |
| Canada | Hungary | Pakistan | Togo |
| Chile | India | Philippines | Tunisia |
| China | Ireland | Poland | Turkey |
| Colombia | Italy | Portugal | Ukraine |
| Cyprus | Jamaica | Romania | United Kingdom |
| Czech Republic | Japan | Rwanda | Vietnam |
| Denmark | Kenya | Saudi Arabia | Yemen |
| Egypt | Kosovo | Singapore | Zimbabwe |